Posted in May 2014

Colour shortcuts in QGIS 2.4

Quick poll… what’s the most frustrating thing about GIS? Fighting with colour plotters? Trying to remember GDAL command line syntax? MapInfo’s new ribbon interface* [1]? All of the above?

Wrong!

It’s getting a colour from here:

colour1

…all the way over to here:

colour2

Since the dawn of GIS humanity has struggled with this simple task* [2]. We’ve come up with multiple techniques for solving this problem, ranging from the RSI inducing “select and copy red value, alt-tab, paste, alt-tab, select and copy green value, alt-tab, paste, etc….” method, through to chanting “70, 145, 160… 70, 145, 160… 70, 145, 150… 70, 145, 150” to ourselves as we frantically try and rearrange dialogs to find the destination colour picker, all the while avoiding strange looks from co-workers.

Fortunately, QGIS 2.4 is coming to the rescue! Now, you can right click on any of QGIS’ colour picker buttons for a handy copy/paste colour shortcut menu. Pasting colours works from a whole range of formats, including hex codes, color names, and css-style “rgb” and “rgba” strings.

Fixed!

Problem solved!

Even better, you can just drag colours from one colour button to another:

Fixed again...

… and solved again…

Or, drag a colour from GIMP and drop it onto a QGIS colour button:

x

… and yet again!

Or even drag a colour from a QGIS button directly onto a shape in Inkscape! All this win is coming your way in QGIS 2.4, due June 2014.

[1] Pre-empting the inevitable flood of complaints when this new interface is rolled out
[2] I assume

Tagged , , , , , , , ,

And now… colour preview modes in QGIS’ map canvas

As a quick follow-up to my last post on colour preview modes for the print composer in QGIS 2.4, this feature has also been added to the main map canvas window! Now it’s even easier to adjust your symbol colours and immediately see how they’d appear under a range of different circumstances:

Colour previews modes for the map canvas

Colour previews modes for the map canvas


Tagged , , , , , , , ,

Colour blindness and grayscale previews in QGIS 2.4

Since QGIS 2.4 is nearing feature freeze it seems like a good time to start exploring some of the great new features in this release. So, let’s get started with my most recent addition to QGIS’ print composer… preview modes!

As every first year cartography text book will tell you, it’s important to know your target media and audience when creating a usable map. Some important considerations are whether or not your map will be photocopied or printed in black and white, and whether you need to consider colour blind map readers in your audience. In the past, designing maps with these considerations has been a time consuming, tedious process. You’d have to export your map, open it in another graphics editing program, apply some colour transform, work out what issues there are, flip back to QGIS, make your changes and repeat. If you’re working with a tight deadline it can be difficult to justify the time this all takes.

QGIS 2.4 will help to make this whole process a lot simpler. In the print composer there’s now an option to enable a number of different live “preview modes“. These include grayscale, monochrome, and two colour blindness simulations (Protanope and Deuteranope).

Composer preview modes in QGIS 2.4

Composer preview modes in QGIS 2.4

These preview modes are live, so you can continue to edit and tweak the colours in your composition while a preview mode is active! For a quick demonstration, let’s start with this creatively coloured thematic map:

bad_colored_map

While it might not be the most aesthetically pleasing map, at least the thematic colours can be easily matched to their corresponding values in the legend. Let’s see what would happen if we photocopied this map. This is as easy as activating the “Simulate photocopy (grayscale)” preview mode:

greyscalepreview

Hmm… not so usable now. The five thematic colours have been reduced to just three discernible colours. Oh well, at least we haven’t had to export our map to find this out, and it’s nice and easy to adjust the colours and composition to work for photocopies without having to leave QGIS to test the results!

Let’s see how this map would look to someone with colour blindness, by activating the “Simulate colour blindness (Protanope)” mode:

color_blindness

In this case, our map isn’t too bad. The different classes are still discernible and the map can be interpreted by someone with protanopia.

So there we have it – now it’s easy to determine how our map outputs will look under different circumstances and adjust them to suit! Composer preview modes will be a part of the upcoming 2.4 release of QGIS, which is due out at the end of June 2014.

Update:

This feature has also been added to the main map canvas.

Tagged , , , , , , ,

Composition styling in QGIS 2.2

Here’s a quick run-down on some new feature in QGIS 2.2 which I never got around to writing about before the release. I feel like I’ve got to give these features their due publicity before moving on to all the exciting new stuff which is being added for 2.4. So, without further ado, let’s take a dive into print composer shape and page styling in QGIS 2.2…

Shape styling

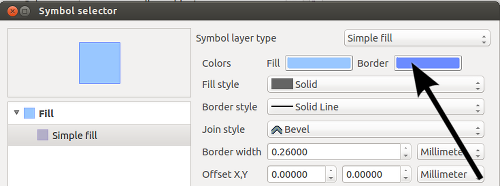
It’s no secret that QGIS has pretty impressive capabilities when it comes to cartographic styling of polygon features. Everything from line and point pattern fills, SVG image fills, gradients and even buffered gradients (new in 2.4 — more on that in a later post) can be used to shade polygons. That’s all in addition to the whole range of line styles which can be used to outline the edges of polygons. In QGIS 2.2 all these fill effects are now available for styling shapes in the print composer. What exactly does this mean?

Well, now you can draw a frame onto your print layout and style it with a gradient fill…

Gradient shape fill in composer

…or a line pattern fill….

Line pattern fill in composer

…or some crazy combination of everything…

Advanced fill in composer

It’s totally up to you how far you take this! Here’s a nice example of a map created in QGIS 2.2’s print composer using these new styling options.

Page styling for compositions

Why is this cool? Well, for a start, if we take a quick look at the QGIS map showcase on Flickr very few of the maps shown there have a white background. In previous versions of QGIS achieving a non-white background would require drawing a giant coloured rectangle over your whole composition, banishing it to the back of the stack, and then continually being annoyed by it getting in the way while you tried to work on the rest of the composition. Now, just like the shape styling described above, you can style the page background using any of the available options in QGIS for polygon fills!

Creating a composition with a black page background

Creating a composition with a black page background

It doesn’t end there though. Since the page background can now be styled like this, it’s also possible to have transparent or semi-transparent page backgrounds. I’ll show the result opened here in GIMP so that you can see the full transparency effect over GIMP’s checkerboard background pattern:

A composition exported with a transparent background

A QGIS 2.2 composition exported with a transparent background

Using a transparent composition background like this also allows for transparency effects in map layers to show through – so, for instance, if your map layer is set to 50% transparent then the resultant export from the composer will also be 50% transparent.

And now for the final stinger…

Have I mentioned yet that you can also use data defined symbology for both shape and page styling? No? Well, this was actually my main motivator in adding styling support to these elements. For a long time I’ve been wanting to create atlases which vary the page background based on attributes in the atlas coverage layer. Think flip-book style maps, where the page border is colour-coded to highlight areas that need attention. For example, areas with high rates showing with red borders, average rates with yellow, and low rates with green borders. Using a combination of page and shape styling, data defined symbology, and QGIS’ atlas features, this is now possible!

…And that (belatedly) wraps up my exploration of new features in QGIS 2.2. Next up I’ll start showcasing all the sweet new features which have landed for 2.4…

Tagged , , , , ,