Tagged with geospatial

Customising the TimeManager time stamp

TimeManager is a fantastic plugin for QGIS which allows you to create animated maps from your data. You can read all about it here and here, and there’s a really nice demonstration of it here.

I’ve been playing with TimeManager a fair bit over the last month, and thought I’d share a quick tip on improving the appearance of TimeManager’s time stamp. TimeManager includes some basic functionality for placing a time stamp in the corner of your outputs, but it’s fairly limited. There’s only some basic appearance options, and no way to control the date or time formats displayed.

Default TimeManager time stamp

Default TimeManager time stamp

But, there’s a trick we can use to get around this: use a temporary point layer for the time stamp label. Let me elaborate:

  1. Create a throwaway point layer. It doesn’t matter what fields or format this layer has.
  2. Add a single point feature to this layer at the place you’d like the improved time stamp to appear at.

    Add a single point feature

    …add a single point feature

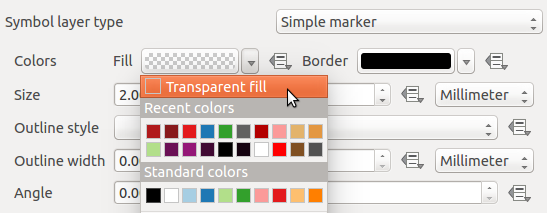
  3. We don’t want to see the marker, so hide the symbol for this layer by setting it to use a transparent fill and outline.

    Transparent fill and outline

    Transparent fill and outline

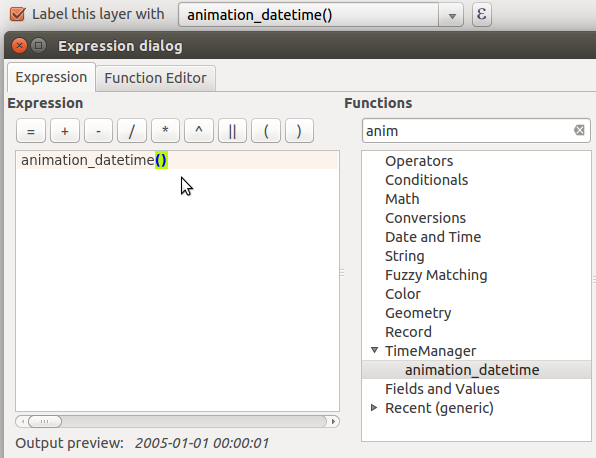
  4. Then, enable labels for this layer. Here’s the trick – set the label expression for the label to use “animation_datetime()” (or for QGIS 2.8, “$animation_datetime”). This is a custom function provided by the TimeManager plugin which evaluates to the current frame’s date and time.

    Setting the layer's label expression

    Setting the layer’s label expression

  5. Now, you can use all the built-in options within QGIS for styling this label. Buffers, drop shadows, background shapes… anything!

    ...tweaking the label appearance

    …tweaking the label appearance

  6. Apply and check. Much nicer!

    Formatted timestamp

    A nicely formatted time stamp

  7. To tweak the formatting of the time stamp’s date and time, you can modify the label expression using the built-in ‘format_date’, ‘year’, ‘month’, etc functions. Let’s try “format_date(animation_datetime(),’ddd dd MMM yyyy’)”:

    Tweaked expression

    Tweaked expression

Now, our final formatted time stamp looks like this:

Final, formatted time stamp

Final, formatted time stamp

…and there we go. Using this simple trick allows you to take advantage of all the possibilities which the QGIS labelling and expression engines allow!

*Bonus points for the first person to use this technique along with data defined controls for animating the label colour/size!

Tagged , , , , ,

Review: Building Mapping Applications with QGIS

It seems like over the last year the amount of literature published regarding QGIS has really exploded. In the past few months alone there’s been at least three titles I can think of (Building Mapping Applications with QGISMastering QGIS, and the QGIS Python Programming Cookbook). I think this is a great sign of a healthy project. Judging by this there’s certainly a lot of demand for quality guides and documentation for QGIS.

I recently finished reading one of these titles – Building Mapping Applications with QGIS. (Erik Westra, Packt Publishing 2015) In short, I’m a huge fan of this work and think it may be my favourite QGIS book to date! I’ve read Erik’s previous work, Python Geospatial Development, and thought it was an entertaining and really well written book. He’s clearly got an in-depth knowledge about what he’s writing about and this confidence comes through in his writing. So when I first saw this title announced I knew it would be a must-read for me.

In Building Mapping Applications with QGIS, Erik has created a comprehensive guide through all the steps required to create QGIS plugins and standalone Python applications which utilise the QGIS libraries. It’s not a beginner’s guide to Python or to PyQGIS, but that’s what helps it stand out. There’s no introductory chapters on programming with Python or how to use QGIS and instead Erik dives straight into the meat of this topic. I found this approach really refreshing, as I’m often frustrated when the first few chapters of an advanced work just cover the basics. Instead, Building Mapping Applications with QGIS is packed with lessons about, well, actually building mapping applications!

So, why do I like this book so much? Personally, I think it fills a a really crucial void in the existing QGIS literature. There’s a lot of works covering using QGIS, and a few covering PyQGIS development (eg, the PyQGIS Programmer’s Guide, which I reviewed here). But to date, there hasn’t been any literature that covers developing QGIS based applications in such great depth. It’s just icing on the cake that Erik’s writing is also so interesting and easy to read.

Is there any criticisms I have with this book? Well, there’s one small omission which I would have liked to see addressed. While the chapter Learning the QGIS Python API goes into some detail about how QGIS is built using the Qt libraries and a great deal of depth about interpreting the QGIS c++ APIs, I think it could really benefit from some discussion about both the PyQt and Qt APIs themselves. Since a lot of the QGIS classes are either directly derived from Qt classes or heavily utilise them it’s really important that PyQGIS developers are also directed to the PyQt and Qt APIs. For instance, the Qt QColor class is used heavily throughout PyQGIS, but you won’t find any API documentation on QColor in QGIS’ API. Instead, you need to first consult the PyQt API docs and also the detailed Qt c++ docs. It’s often that you may think the PyQGIS API is missing a crucial method, but consulting the Qt docs reveals that the method is instead implemented in the base classes. It’s an important point to note for mastering PyQGIS development. To be fair, I’m yet to read a PyQGIS book which has nailed the interaction between the QGIS, PyQt and Qt APIs.

Honestly, that’s a really minor quibble with an otherwise outstanding work. I’m so glad Erik’s written this work and strongly recommend it to anyone wanting to take their PyQGIS development skills to the next level.

Tagged , ,

Introducing QGIS live layer effects!

I’m pleased to announce that the crowdfunded work on layer effects for QGIS is now complete and available in the current development snapshots! Let’s dive in and explore how these effects work, and check out some of the results possible using them.

I’ll start with a simple polygon layer, with some nice plain styling:

Nice and boring polygon layer

A nice and boring polygon layer

If I open the properties for this layer and switch to the Style tab, there’s a new checkbox for “Draw effects“. Let’s enable that, and then click the little customise effects button to its right:
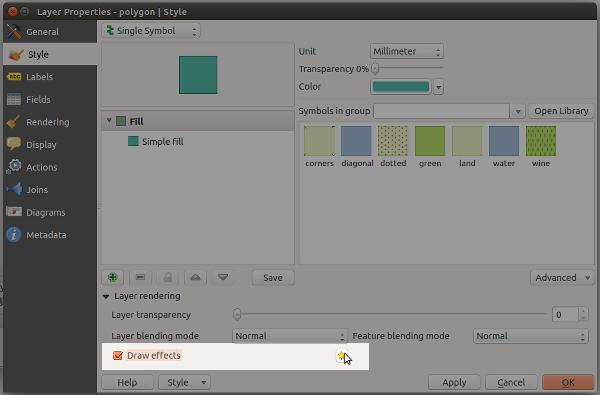
Enabling effects for the layer

Enabling effects for the layer

A new “Effects Properties” dialog opens:

Effects Properties dialog

Effects Properties dialog

You can see that currently the only effect listed is a “Source” effect. Source effects aren’t particularly exciting – all they do is draw the original layer unchanged. I’m going to change this to a “Blur” effect by clicking the “Effect type” combo box and selecting “Blur“:
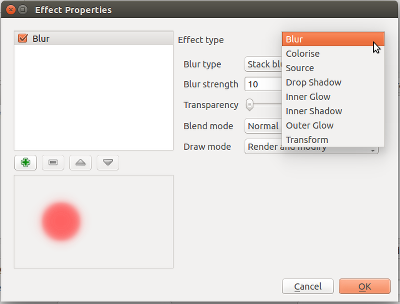
Changing to a blur effect

Changing to a blur effect

If I apply the settings now, you’ll see that the polygon layer is now blurry. Now we’re getting somewhere!

Blurry polygons!

Blurry polygons!

Ok, so back to the Effects Properties dialog. Let’s try something a bit more advanced. Instead of just a single effect, it’s possible to chain multiple effects together to create different results. Let’s make a traditional drop shadow by adding a “Drop shadow” effect under the “Source” effect:

Setting up a drop shadow

Setting up a drop shadow

Effects are drawn top-down, so the drop shadow will appear below the source polygons:

Live drop shadows!

Live drop shadows!

Of course, if you really wanted, you could rearrange the effects so that the drop shadow effect is drawn above the source!..

Hmmmm

Hmmmm…

You can stack as many effects as you like. Here’s a purple inner glow over a source effect, with a drop shadow below everything:
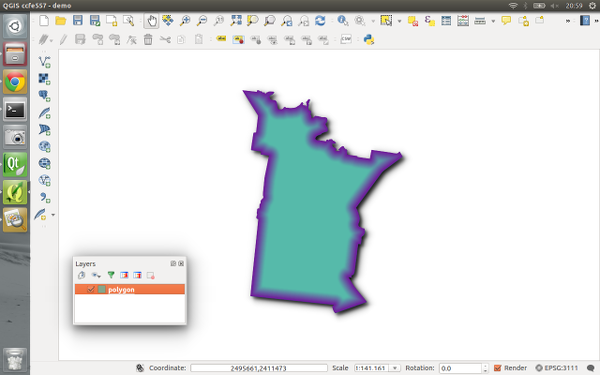
Inner glow, source, drop shadow...

Inner glow, source, drop shadow…

Now it’s time to get a bit more creative… Let’s explore the “transform” effect. This effect allows you to apply all kinds of transformations to your layer, including scaling, shearing, rotation and translation:

The transform effect

The transform effect

Here’s what the layer looks like if I add a horizontally shearing transform effect above an outer glow effect:

Getting freaky...

Getting tricky…

Transforms can get really freaky. Here’s what happens if we apply a 180° rotation to a continents layer (with a subtle nod to xkcd):
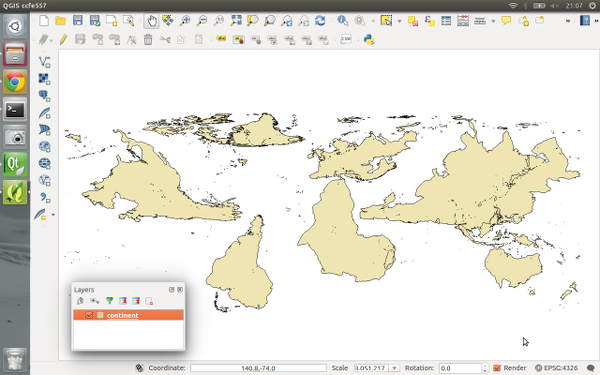
Change your perspective on the world!

Change your perspective on the world!

Remember that all these effects are applied when the layers are rendered, so no modifications are made to the underlying data.

Now, there’s one last concept regarding effects which really blasts open what’s possible with them, and that’s “Draw modes“. You’ll notice that this combo box contains a number of choices, including “Render“, “Modify” and “Render and Modify“:
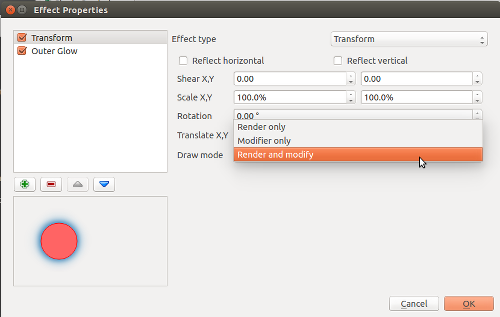
"Draw mode" options

“Draw mode” options

These draw modes control how effects are chained together. It’s easiest to demonstrate how draw modes work with an example, so this time I’ll start with a Transform effect over a Colorise effect. The transform effect is set to a 45° rotation, and the colorise effect set to convert to grayscale. To begin, I’ll set the transform effect to a draw mode of Render only:

The "Render only" draw mode

The “Render only” draw mode

In this mode, the results of the effect will be drawn but won’t be used to modify the underlying effects:
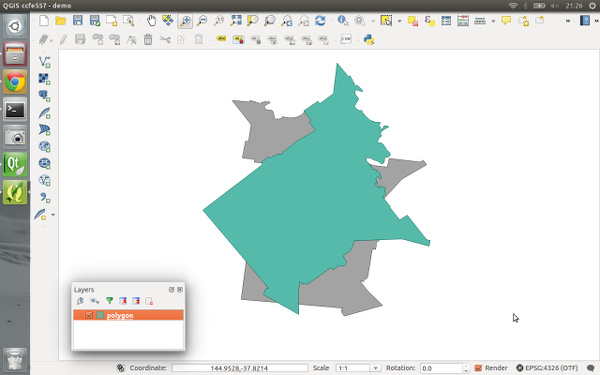
Rotation effect over the grayscale effect

Rotation effect over the grayscale effect

So what we have here is that the polygon is drawn rotated by 45° by the transform effect, and then underneath that there’s a grayscale copy of the original polygon drawn by the colorise effect. The results of the transform effect have been rendered, but they haven’t affected the underlying colorise effect.

If I instead set the Transform effect’s draw mode to “Modifier only” the results are quite different:
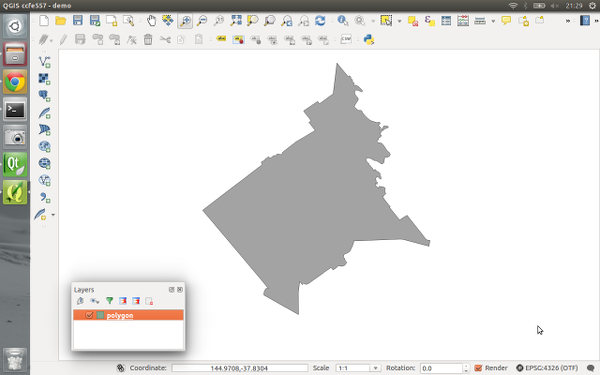
Rotation modifier for grayscale effect

Rotation modifier for grayscale effect

Now, the transform effect is rotating the polygon by 45° but the result is not rendered. Instead, it is passed on to the subsequent colorise effect, so that now the colorise effect draws a grayscale copy of the rotated polygon. Make sense? We could potentially chain a whole stack of modifier effects together to get some great results. Here’s a transform, blur, colorise, and drop shadow effect all chained together using modifier only draw modes:
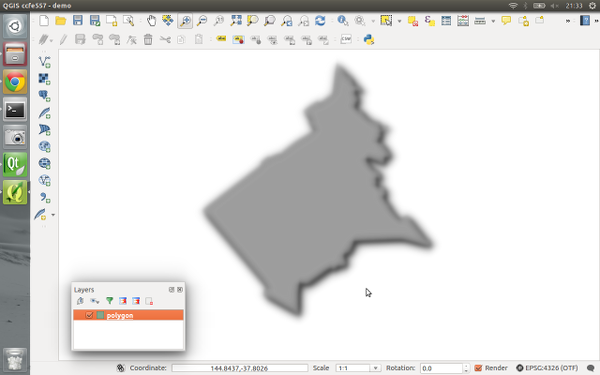
A stack of modifier effects

A stack of modifier effects

The final draw mode, “Render and modify” both renders the effect and applies its result to underlying effects. It’s a combination of the two other modes. Using draw modes to customise the way effects chain is really powerful. Here’s a combination of effects which turn an otherwise flat star marker into something quite different:
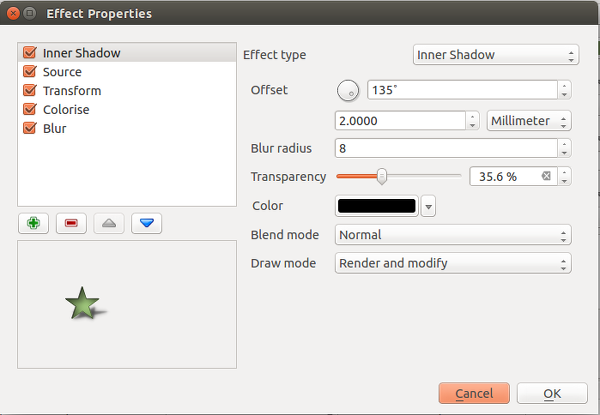
Lots of effects!

Lots of effects!

The last thing I’d like to point out is that effects can be either applied to an entire layer, or to the individual symbol layers for features within a layer. Basically, the possibilities are almost endless! Python plugins can also extend this further by implementing additional effects.

All this work was funded through the 71 generous contributors who donated to the crowdfunding campaign. A big thank you goes out to you all whole made this work possible! I honestly believe that this feature takes QGIS’ cartographic possibilities to whole new levels, and I’m really excited to see the maps which come from it.

Lastly, there’s two other crowdfunding campaigns which are currently in progress. Lutra consulting is crowdfunding for a built in auto trace feature, and Radim’s campaign to extend the functionality of the QGIS GRASS plugin. Please check these out and contribute if you’re interested in their work and would like to see these changes land in QGIS.

Tagged , , , , , ,

QGIS – live layer effects Kickstarter update

Here’s another quick video demonstration of the latest developments in layer effects – effects on polygon and polyline layers, and outer glow effects:

Time is running out to fund this campaign and make this work happen… Please donate via Kickstarter!

I’ve also been asked what will happen if funding exceeds the Kickstarter goal? Well, if this happens, the extra funds will be used to add additional layer effects to QGIS. Next up will be inner glow, inner shadow and color modification effects.

Tagged , , ,

Kickstarter Alert – Live Layer Effects for QGIS

QGIS is well regarded for its fantastic cartographic abilities – it’s got a huge range of symbology styles and options which can be used to style your maps. But there’s more we can do to push this even further.

One long requested cartographic feature has been for live drop shadows on layers. Why stop there? Why not inner and outer glow effects and live blur effects? Just imagine the cartographic possibilities if this functionality was available from within a GIS, and didn’t require exporting maps to external editors…

I’ve launched a Kickstarter project to fund implementing live layer effects like this within QGIS. Please consider donating or spreading the word if you’d find this feature useful!

Tagged , , , , ,

Exploring QGIS 2.6 – Item panel for map composer

In recent releases QGIS’ map composer has undergone some large usability improvements, such as the ability to select and interact with multiple items, and much improved navigation of compositions. Another massive usability improvement which is included in QGIS 2.6 is the new “Items” panel in the map composer. The panel shows a list of all items currently in the composition, and allows you to individually select, show or hide items, toggle their lock status, and rearrange them via drag and drop. You can also double click the item’s description to modify its ID, which makes managing items in the composition much easier.

QGIS composer’s new items panel

This change has been on my wish list for a long time. The best bit is that implementing the panel has allowed me to fix some of the composer’s other biggest usability issues. For instance, now locked items are no longer selectable in the main composer view. If you’ve ever tried to create fancy compositions with items which are stacked on top of other items, you’ll know that trying to interact with the lower items has been almost impossible in previous QGIS versions. Now, if you lock the higher stacked items you’ll be able to fully interact with all underlying items without the higher items getting in the way. Alternatively you could just temporarily hide them while you work with the lower items.

This feature brings us one more step closer to making QGIS’ map composer a powerful DTP tool in itself. If you’d like to help support further improvements like this in QGIS, please consider sponsoring my development work, or you can contact me directly for a quote on specific development.

Tagged , , , ,

Creating custom colour schemes in PyQGIS

In my last post I explored some of the new colour related features available in QGIS 2.6. At the end of that post I hinted at the possibility of creating QGIS colour schemes using python. Let’s take a look…

We’ll start with something nice and easy – a colour scheme which contains a predefined set of colours (e.g., standard company colours). This is done by subclassing QgsColorScheme and implementing the required methods ‘schemeName‘, ‘fetchColors‘ and ‘clone‘. It’s all fairly self explanatory – most of the important stuff happens in fetchColors, which returns a list of QColor/string pairs. Here’s a sample:

from PyQt4.QtCore import *
from PyQt4.QtGui import *

class QgsCgaLightColorScheme(QgsColorScheme):
    def __init__(self, parent=None): 
        QgsColorScheme.__init__(self)
 
    def schemeName(self):
        return "CGA Colors!"
 
    def fetchColors(self,context='', basecolor=QColor()):
        return [[QColor('#555555'),'Gray'],
                    [QColor('#5555FF'),'Light Blue'],
                    [QColor('#55FF55'),'Light Green'],
                    [QColor('#55FFFF'),'Light Cyan'],
                    [QColor('#FF5555'),'Light Red'],
                    [QColor('#FF55FF'),'Light Magenta'],
                    [QColor('#FFFF55'),'Yellow'],
                    [QColor('#FFFFFF'),'White']]
    def flags(self):
        return QgsColorScheme.ShowInAllContexts
 
    def clone(self):
        return QgsCgaLightColorScheme()

cgaScheme = QgsCgaLightColorScheme()
QgsColorSchemeRegistry.instance().addColorScheme(cgaScheme)

This scheme will now appear in all colour buttons and colour picker dialogs:

CGA colours… what your map was missing!

If you only wanted the scheme to appear in the colour picker dialog, you’d modify the flags method to return QgsColorScheme.ShowInColorDialog instead.

QgsColorSchemes can also utilise a “base colour” when generating their colour list. Here’s a sample colour scheme which generates slightly randomised variations on the base colour. The magic again happens in the fetchColors method, which copies the hue of the base colour and generates random saturation and value components for the returned colours.

from PyQt4.QtCore import *
from PyQt4.QtGui import *
import random

class QgsRandomColorScheme(QgsColorScheme):
    def __init__(self, parent=None): 
        QgsColorScheme.__init__(self)

    def schemeName(self):
        return "Random colors!"

    def fetchColors(self, context='', basecolor=QColor() ):
        noColors = random.randrange(30)
        minVal = 130;
        maxVal = 255;
        colorList = []
        for i in range(noColors):
            if basecolor.isValid():
                h = basecolor.hue()
            else:
                #generate random hue
                h = random.randrange(360);

            s = random.randrange(100,255)
            v = random.randrange(100,255)

            colorList.append( [ QColor.fromHsv( h, s, v), "random color! " + str(i) ] )

        return colorList

    def flags(self):
        return QgsColorScheme.ShowInAllContexts

    def clone(self):
        return QgsRandomColorScheme()

randomScheme = QgsRandomColorScheme()
QgsColorSchemeRegistry.instance().addColorScheme(randomScheme)

Here’s the random colour scheme in action… note how the colours are all based loosely around the current red base colour.

Randomised colours

You may also have noticed the context argument for fetchColors. This can be used to tweak the returned colour list depending on the context of the colour picker. Possible values include ‘composer‘, ‘symbology‘, ‘gui‘ or ‘labelling‘.

One final fun example… here’s a colour scheme which grabs its colours using the Colour Lovers API to fetch a random popular palette from the site:

from PyQt4.QtCore import *
from PyQt4.QtGui import *
from xml.etree import ElementTree
import urllib2
import random

class colorLoversScheme(QgsColorScheme):

    def __init__(self, parent=None): 
        QgsColorScheme.__init__(self)
        xmlurl = 'http://www.colourlovers.com/api/palettes/top'

        headers = { 'User-Agent' : 'Mozilla/5.0' }
        req = urllib2.Request(xmlurl, None, headers)
        doc = ElementTree.parse(urllib2.urlopen(req)).getroot()

        palettes = doc.findall('palette')
        palette = random.choice(palettes)

        title = palette.find('title').text
        username = palette.find('userName').text
        attrString = title + ' by ' + username
        colors = ['#'+c.text for c in palette.find('colors').findall('hex')]

        self.color_list = [[QColor(c), attrString] for c in colors]

    def schemeName(self):
        return "Color lovers popular palette"

    def fetchColors(self, context='', basecolor=QColor()):
        return self.color_list

    def flags(self):
        return QgsColorScheme.ShowInAllContexts

    def clone(self):
        return colorLoversScheme()

loversScheme = colorLoversScheme()      
QgsColorSchemeRegistry.instance().addColorScheme( loversScheme )

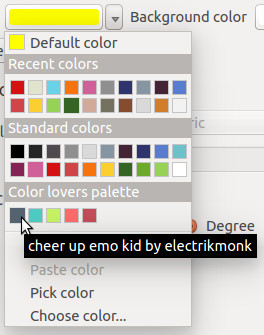
Clicking a colour button will now give us some daily colour scheme inspiration…

Grabbing a palette from the Colours Lovers site

Grabbing a palette from the Colours Lovers site

Ok, now it’s over to all you PyQGIS plugin developers – time to go wild!

Tagged , , , ,

What’s new in QGIS 2.6 – Tons of colour improvements!

With one month left before the release of QGIS 2.6, it’s time to dive into some of the new features it will bring… starting with colours.

Working with colours is a huge part of cartography. In QGIS 2.4 I made a few changes to improve interaction with colours. These included the ability to copy and paste colours by right clicking on a colour button, and dragging-and-dropping colours between buttons. However, this was just the beginning of the awesomeness awaiting colours in QGIS 2.6… so let’s dive in!

Part 1 – New colour picker dialog

While sometimes it’s best to stick with an operating system’s native dialog boxes, colour pickers are one exception to this. That’s because most native colours pickers are woefully inadequate, and are missing a bunch of features which make working with colours much easier. So, in QGIS 2.6, we’ve taken the step of rolling out our very own colour picker:

New QGIS colour picker

Before starting work on this, I conducted a review of a number of existing colour picker implementations to find out what works and what doesn’t. Then, I shamelessly modelled this new dialog off the best bits of all of these! (GIMP users will find the new dialog especially familiar – that’s no coincidence, it’s a testament to how well crafted GIMP’s colour picker is.)

The new QGIS colour picker features:

  • Colour sliders and spin boxes for Hue, Saturation, Value, Red, Green and Blue colour components
  • An opacity slider (no more guessing what level of transparency “189” corresponds to!)
  • A text entry box which accepts hex colours, colour names and CSS rgb(#,#,#) type colours. (The drop down arrow you can see on this box in the screenshot above allows you to specify the display format for colours, with options like #RRGGBB and #RRGGBBAA)
  • A grid of colour swatches for storing custom colours
  • A visual preview of the new colour compared to the previous colour
  • Support for dragging and dropping colours into and out of the dialog
  • A colour wheel and triangle method for tweaking colours (by the way, all these colour widgets are reusable, so you can easily dump them into your PyQGIS plugins)
    Colour wheel widget
  • A colour palettes tab. This tab supports adding and removing colours from a palette, creating new palettes and importing and exporting colours from a GPL palette file. (We’ll explore colour palettes in more detail later in this post.)
    Colour palettes
  • A colour sampler! This tab allows you to sample a colour from under the mouse pointer. Just click the “Sample color” button, and then click anywhere on the screen (or press the space bar if you’re sampling outside of the QGIS window). You even get the choice of averaging the colour sample over a range of pixels. (Note that support for sampling is operating system dependant, and currently it is not available under OSX.)
    Built in colour sampler! Woohoo!

Part 2 – New colour button menus

Just like the new colour dialog is heavily based off other colour dialog implementations, this new feature is inspired by Microsoft’s excellent colour buttons in their recent Office versions (I make no claim to originality here!). Now, all QGIS colour buttons come with a handy drop down menu which allows you to quickly choose from some frequently used colour shortcuts. You’ve got the previously available options of copying and pasting colours from 2.4, plus handy swatches for recently used colours and for other standard colours.

colour_menu

Handy colour menu for buttons

Part 3 – Colour palettes

You may have noticed in the above screenshot the “Standard colors” swatches, and wondered what these were all about.  Well, QGIS 2.6 has extensive support for color palettes. There’s a few different “built-in” color palettes:

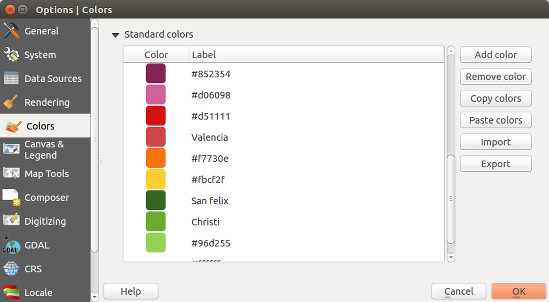
  • The “Standard colors” palette. This palette can be modified through the Options → Colors tab. You can add, remove, edit, and rename colours, as well as import color schemes from a GPL palette file. These standard colours apply to your QGIS installation, so they’ll be available regardless of what project you’re currently working on.

    Customising the standard colours

    Customising the standard QGIS colours

  • The “Project colors” palette. This can be accessed via the Project Properties → Default styles tab. This palette is saved inside the .qgs project file, so it’s handy for setting up a project-specific colour scheme.
  • The “Recent colors” palette. This simply shows colours you’ve recently used within QGIS.

You can easily create new colour palettes directly from the colour picker dialog. Behind the scenes, these palettes are saved into your .qgis/palettes folder as standard GPL palette files, which makes it nice and easy to modify them in other apps or transfer them between installations. It’s also possible to just dump a stack of quality palettes directly into this folder and they’ll be available from within QGIS.

Perhaps the best bit about colour schemes in QGIS is that they can be created using PyQGIS plugins, which opens up tons of creative possibilities… More on this in a future blog post!

So there we go. Tons of improvements for working with colours are heading your way in QGIS 2.6, which is due out on the 24th October.

(Before we end, let’s take a quick look at what the competition offers over in MapInfo land. Yeah… no thanks. You might want to invest some development time there Pitney Bowes!)

Tagged , , , ,

Shapeburst fill styles in QGIS 2.4

With QGIS 2.4 getting closer (only a few weeks away now) I’d like to take some time to explore an exciting new feature which will be available in the upcoming release… shapeburst fills!

As a bit of background, QGIS 2.2 introduced a gradient fill style for polygons, which included linear, radial and conical gradients. While this was a nice feature, it was missing the much-requested ability to create so-called “buffered” gradient fills. If you’re not familiar with buffered gradients, a great example is the subtle shading of water bodies in the latest incarnation of Google maps. ArcGIS users will also be familiar with the type of effects possible using buffered gradients.

Gradient fills on water bodies in Google maps

Gradient fills on water bodies in Google maps

Implementing buffered gradients in QGIS originally started as a bit of a challenge to myself. I wanted to see if it was possible to create these fill effects without a major impact on the rendering speed of a layer. Turns out you can… well, you can get pretty close anyway. (QGIS 2.4’s new multi-threaded responsive rendering helps a lot here too).

So, without further delay, let’s dive into how shapeburst fills work in QGIS 2.4! (I’ve named this fill effect ‘shapeburst fills’, since that’s what GIMP calls it and it sounds much cooler than ‘buffered gradients’!)

Basic shapeburst fills

For those of you who aren’t familiar with this fill effect, a shapeburst fill is created by shading each pixel in the interior of a polygon by its distance to the closest edge. Here’s how a lake feature polygon looks in QGIS 2.4 with a shapeburst from a dark blue to a lighter blue colour:

A simple shapeburst fill from a dark blue to a lighter blue

A simple shapeburst fill from a dark blue to a lighter blue

You can see in the image above that both polygons are shaded with the dark blue colour at their outer boundaries through to the lighter blue at their centres. The screenshot below shows the symbol settings used to create this particular fill:

A simple shapeburst fill from a dark blue to a lighter blue

Creating a simple shapeburst fill from a dark blue to a lighter blue

Here we’ve used the ‘Two color‘ option, and chosen our shades of blue manually. You can also use the ‘Color ramp’ option, which allows shading using a complex gradient containing multi stops and alpha channels. In the image below I’ve created a red to yellow to transparent colour ramp for the shapeburst:

Colour ramp shapeburst with alpha channels

Colour ramp shapeburst with alpha channels

Controlling shading distance

In the above examples the shapeburst fill has been drawn using the whole interior of the polygon. If desired, you can change this behaviour and instead only shade to a set distance from the polygon edge. Let’s take the blue shapeburst from the first example above and set it to shade to a distance of 5 mm from the edge:

Shapeburst fills can shade to a set distance only

Shapeburst fills can also shade to a set distance from the polygon’s exterior

This distance can either be set in millimetres, so that it stays constant regardless of the map’s scale, or in map units, so that it scales along with the map. Here’s what our lake looks like shaded to a 5 millimetre distance:

Shading to 5mm from the lake's edge

Shading to 5mm from the lake’s edge

Let’s zoom in on a portion of this shape and see the result. Note how the shaded distance remains the same even though we’ve increased the scale:

Zooming in maintains a constant shaded distance

Zooming in maintains a constant shaded distance

Smoothing shapeburst fills

A pure buffered gradient fill can sometimes show an odd optical effect which gives it an undesirable ‘spiny’ look for certain polygons. This is most strongly visible when using two highly contrasting colours for the fill. Note the white lines which appear to branch toward the polygon’s exterior in the image below:

Spiny artefacts on a pure buffered gradient fill

Spiny artefacts on a pure buffered gradient fill

To overcome this effect, QGIS 2.4 offers the option to blur the results of a shapeburst fill:

Blur option for shapeburst fills

Blur option for shapeburst fills

Cranking up the blur helps smooth out these spines and results in a nicer fill:

Adding a blur to the shapeburst fill

Adding a blur to the shapeburst fill

Ignoring interior rings

Another option you can control for shapeburst fills is whether interior polygon rings should be ignored. This option is useful for shading water bodies to give the illusion of depth. In this case you may not want islands in the polygon to affect their surrounding water ‘depth’. So, checking the ‘Ignore rings in polygons while shading‘ option results in this fill:

Ignoring interior rings while shading

Ignoring interior rings while shading

Compare this image with the first image posted above, and note how the shading differs around the small island on the polygon’s left.

Some extra bonuses…

There’s two final killer features with shapeburst fills I’d like to highlight. First, every parameter for the fill can be controlled via data defined expressions. This means every feature in your layer could have a different start and end colour, distance to shade, or blur strength, and these could be controlled directly from the attributes of the features themselves! Here’s a quick and dirty example using a random colour expression to create a basic ‘tint band‘ effect:

Using a data defined expression for random colours

Using a data defined expression for random colours

Last but not least, shapeburst fills also work nicely with QGIS 2.4’s new “inverted polygon” renderer. The inverted polygon renderer flips a normal fill’s behaviour so that it shades the area outside a polygon. If we combine this with a shapeburst fill from transparent to opaque white, we can achieve this kind of masking effect:

Creating a smooth exterior mask using the "inverted polygons" renderer

Creating a smooth exterior mask using the “inverted polygons” renderer

This technique plays nicely with atlas prints, so you can now smoothly fade out the areas outside of your coverage layer’s features for every page in your atlas print!

All this and more, coming your way in a few short weeks when QGIS 2.4 is officially released…

Tagged , , , , , ,

Colour shortcuts in QGIS 2.4

Quick poll… what’s the most frustrating thing about GIS? Fighting with colour plotters? Trying to remember GDAL command line syntax? MapInfo’s new ribbon interface* [1]? All of the above?

Wrong!

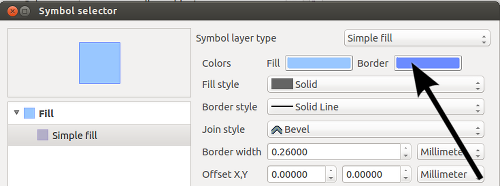
It’s getting a colour from here:

colour1

…all the way over to here:

colour2

Since the dawn of GIS humanity has struggled with this simple task* [2]. We’ve come up with multiple techniques for solving this problem, ranging from the RSI inducing “select and copy red value, alt-tab, paste, alt-tab, select and copy green value, alt-tab, paste, etc….” method, through to chanting “70, 145, 160… 70, 145, 160… 70, 145, 150… 70, 145, 150” to ourselves as we frantically try and rearrange dialogs to find the destination colour picker, all the while avoiding strange looks from co-workers.

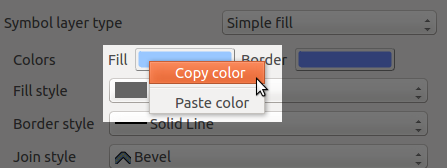
Fortunately, QGIS 2.4 is coming to the rescue! Now, you can right click on any of QGIS’ colour picker buttons for a handy copy/paste colour shortcut menu. Pasting colours works from a whole range of formats, including hex codes, color names, and css-style “rgb” and “rgba” strings.

Fixed!

Problem solved!

Even better, you can just drag colours from one colour button to another:

Fixed again...

… and solved again…

Or, drag a colour from GIMP and drop it onto a QGIS colour button:

x

… and yet again!

Or even drag a colour from a QGIS button directly onto a shape in Inkscape! All this win is coming your way in QGIS 2.4, due June 2014.

[1] Pre-empting the inevitable flood of complaints when this new interface is rolled out
[2] I assume

Tagged , , , , , , , ,