Tagged with cartography

About label halos

A lot of cartographers have a love/hate relationship with label halos. On one hand they can be an essential technique for improving label readability, especially against complex background layers. On the other hand they tend to dominate maps and draw unwanted attention to the map labels.

In this post I’m going to share my preferred techniques for using label halos. I personally find this technique is a good approach which minimises the negative effects of halos, while still providing a good boost to label readability. (I’m also going to share some related QGIS 3.0 news at the end of this post!)

Let’s start with some simple white labels over an aerial image:

These labels aren’t very effective. The complex background makes them hard to read, especially the “Winton Shire” label at the bottom of the image. A quick and nasty way to improve readability is to add a black halo around the labels:

Sure, it’s easy to read the labels now, but they stand out way too much and it’s difficult to see anything here except the labels!

We can improve this somewhat through a better choice of halo colour:

This is much better. We’ve got readable labels which aren’t too domineering. Unfortunately the halo effect is still very prominent, especially where the background image varies a lot. In this case it works well for the labels toward the middle of the map, but not so well for the labels at the top and bottom.

A good way to improve this is to take advantage of blending (or “composition”) modes (which QGIS has native support for). The white labels will be most readable when there’s a good contrast with the background map, i.e. when the background map is dark. That’s why we choose a halo colour which is darker than the text colour (or vice versa if you’ve got dark coloured labels). Unfortunately, by choosing the mid-toned brown colour to make the halos blend in more, we are actually lightening up parts of this background layer and both reducing the contrast with the label and also making the halo more visible. By using the “darken” blend mode, the brown halo will only be drawn for pixels were the brown is darker then the existing background. It will darken light areas of the image, but avoid lightening pixels which are already dark and providing good contrast. Here’s what this looks like:

The most noticeable differences are the labels shown above darker areas – the “Winton Shire” label at the bottom and the “Etheridge Shire” at the top. For both these labels the halo is almost imperceptible whilst still subtly doing it’s part to make the label readable. (If you had dark label text with a lighter halo color, you can use the “lighten” blend mode for the same result).

The only issue with this map is that the halo is still very obvious around “Shire” in “Richmond Shire” and “McKinlay” on the left of the map. This can be reduced by applying a light blur to the halo:

There’s almost no loss of readability by applying this blur, but it’s made those last prominent halos disappear into the map. At first glance you probably wouldn’t even notice that there’s any halos being used here. But if we compare back against the original map (which used no halos) we can see the huge difference in readability:

Compare especially the Winton Shire label at the bottom, and the Richmond Shire label in the middle. These are much clearer on our tweaked map versus the above image.

Now for the good news… when QGIS 3.0 is released you’ll no longer have to rely on an external illustration/editing application to get this effect with your maps. In fact, QGIS 3.0 is bringing native support for applying many types of live layer effects to label buffers and background shapes, including blur. This means it will be possible to reproduce this technique directly inside your GIS, no external editing or tweaking required!

Tagged , , , , , ,

New map coloring algorithms in QGIS 3.0

It’s been a long time since I last blogged here. Let’s just blame that on the amount of changes going into QGIS 3.0 and move on…

One new feature which landed in QGIS 3.0 today is a processing algorithm for automatic coloring of a map in such a way that adjoining polygons are all assigned different color indexes. Astute readers may be aware that this was possible in earlier versions of QGIS through the use of either the (QGIS 1.x only!) Topocolor plugin, or the Coloring a map plugin (2.x).

What’s interesting about this new processing algorithm is that it introduces several refinements for cartographically optimising the coloring. The earlier plugins both operated by pure “graph” coloring techniques. What this means is that first a graph consisting of each set of adjoining features is generated. Then, based purely on this abstract graph, the coloring algorithms are applied to optimise the solution so that connected graph nodes are assigned different colors, whilst keeping the total number of colors required minimised.

The new QGIS algorithm works in a different way. Whilst the first step is still calculating the graph of adjoining features (now super-fast due to use of spatial indexes and prepared geometry intersection tests!), the colors for the graph are assigned while considering the spatial arrangement of all features. It’s gone from a purely abstract mathematical solution to a context-sensitive cartographic solution.

The “Topological coloring” processing algorithm

Let’s explore the differences. First up, the algorithm has an option for the “minimum distance between features”. It’s often the case that features aren’t really touching, but are instead just very close to each other. Even though they aren’t touching, we still don’t want these features to be assigned the same color. This option allows you to control the minimum distance which two features can be to each other before they can be assigned the same color.

The biggest change comes in the “balancing” techniques available in the new algorithm. By default, the algorithm now tries to assign colors in such a way that the total number of features assigned each color is equalised. This avoids having a color which is only assigned to a couple of features in a large dataset, resulting in an odd looking map coloration.

Balancing color assignment by count – notice how each class has a (almost!) equal count

Another available balancing technique is to balance the color assignment by total area. This technique assigns colors so that the total area of the features assigned to each color is balanced. This mode can be useful to help avoid large features resulting in one of the colors appearing more dominant on a colored map.

Balancing assignment by area – note how only one large feature is assigned the red color

The final technique, and my personal preference, is to balance colors by distance between colors. This mode will assign colors in order to maximize the distance between features of the same color. Maximising the distance helps to create a more uniform distribution of colors across a map, and avoids certain colors clustering in a particular area of the map. It’s my preference as it creates a really nice balanced map – at a glance the colors look “randomly” assigned with no discernible pattern to the arrangement.

Balancing colors by distance

As these examples show, considering the geographic arrangement of features while coloring allows us to optimise the assigned colors for cartographic output.

The other nice thing about having this feature implemented as a processing algorithm is that unlike standalone plugins, processing algorithms can be incorporated as just one step of a larger model (and also reused by other plugins!).

QGIS 3.0 has tons of great new features, speed boosts and stability bumps. This is just a tiny taste of the handy new features which will be available when 3.0 is released!

Tagged , , , , ,

Recent labelling improvements in QGIS master

If you’re not like me and don’t keep a constant eye over at QGIS development change log (be careful – it’s addictive!), then you’re probably not aware of a bunch of labelling improvements which recently landed in QGIS master version. I’ve been working recently on a large project which involves a lot (>300) of atlas map outputs, and due to the size of this project it’s not feasible to manually tweak placements of labels. So, I’ve been totally at the mercy of QGIS’ labelling engine for automatic label placements. Generally it’s quite good but there were a few things missing which would help this project. Fortunately, due to the open-source nature of QGIS, I’ve been able to dig in and enhance the label engine to handle these requirements (insert rhetoric about beauty of open source here!). Let’s take a look at them one-by-one:

Data defined quadrant in “Around Point” placement mode

First up, it’s now possible to specify a data defined quadrant when a point label is set to the Around Point placement mode. In the past, you had a choice of either Around Point mode, in which QGIS automatically places labels around point features in order to maximise the number of labels shown, or the Offset from Point mode, in which all labels are placed at a specified position relative to the points (eg top-left). In Offset from Point mode you could use data defined properties to force labels for a feature to be placed at a specific relative position by binding the quadrant to a field in your data. This allowed you to manually tweak the placement for individual labels, but at the cost of every other label being forced to the same relative position. Now, you’ve also got the option to data define the relative position when in Around Point mode, so that the rest of the labels will fall back to being automatically placed. Here’s a quick example – I’ll start with a layer with labels in Around Point mode:

Around Point placement mode

Around Point placement mode

You can see that some labels are sitting to the top right of the points, others to the bottom right, and some in the top middle, in order to fit all the labels for these points. With this new option, I can setup a data defined quadrant for the labels, and then force the ‘Tottenham’ label (top left of the map) to display below and to the left of the point:

Setting a data-defined quadrant

Setting a data-defined quadrant

Here’s what the result looks like:

Manually setting the quadrant for the Tottenham label

Manually setting the quadrant for the Tottenham label

The majority of the labels are still auto-placed, but Tottenham is now force to the lower left corner.

Data defined label priority

Another often-requested feature which landed recently is the ability to set the priority for individual labels. QGIS has long had the ability to set the priority for an entire labelling layer, but you couldn’t control the priority of features within a layer. That would lead to situations like that shown below, where the most important central station (the green point) hasn’t been labelled:

What... no label for the largest station in Melbourne?

What… no label for the largest station in Melbourne?

By setting a data defined priority for labels, I can set the priority either via values manually entered in a field or by taking advantage of an existing “number of passengers” field present in my data. End result is that this central station is now prioritised over any others:

Much better! (in case you're wondering... I've manually forced some other non-optimal placement settings for illustrative purposes!)

Much better! (in case you’re wondering… I’ve manually forced some other non-optimal placement settings for illustrative purposes!)

Obstacle only layers

The third new labelling feature is the option for “Obstacle only” layers. What this option does is allow a non-labelled layer to act as an obstacle for the labels in other layers, so they will be discouraged from drawing labels over the features in the obstacle layer. Again, it’s best demonstrated with an example. Here’s my stations layer with labels placed automatically – you can see that some labels are placed right over the features in the rail lines layer:

Labels over rail lines...

Labels over rail lines…

Now, let’s set the rail lines layer to act as an obstacle for other labels:

... setting the layer as an obstacle...

… setting the layer as an obstacle…

The result is that labels will be placed so that they don’t cover the rail lines anymore! (Unless there’s no other choice). Much nicer.

No more clashing labels!

No more clashing labels!

Control over how polygons act as obstacles for labels

This change is something I’m really pleased about. It’s only applicable for certain situations, but when it works the improvements are dramatic.

Let’s start with my labelled stations map, this time with an administrative boundary layer in the background:

Stations with administrative boundaries

Stations with administrative boundaries

Notice anything wrong with this map? If you’re like me, you won’t be able to look past those labels which cross over the admin borders. Yuck. What’s happening here is that although my administrative regions layer is set to discourage labels being placed over features, there’s actually nowhere that labels can possibly be placed which will avoid this. The admin layer covers the entire map, so regardless of where the labels are placed they will always cover an administrative polygon feature. This is where the new option to control how polygon layers act as obstacles comes to the rescue:

...change a quick setting...

…change a quick setting…

Now, I can set the administrative layer to only avoid placing labels over feature’s boundaries! I don’t care that they’ll still be placed inside the features (since we have no choice!), but I don’t want them sitting on top of these boundaries. The result is a big improvement:

Much better!

Much better!

Now, QGIS has avoided placing labels over the boundaries between regions. Better auto-placement of labels like this means much less time required manually tweaking their positioning, and that’s always a good thing!

Draw only labels which fit inside a polygon

The last change is fairly self explanatory, so no nice screenshots here. QGIS now has the ability to prevent drawing labels which are too large to fit inside their corresponding polygon features. Again, in certain circumstances this can make a huge cartographic improvement to your map.

So there you go. Lots of new labelling goodies to look forward to when QGIS 2.12 rolls around.


Tagged , , , , ,

Introducing QGIS live layer effects!

I’m pleased to announce that the crowdfunded work on layer effects for QGIS is now complete and available in the current development snapshots! Let’s dive in and explore how these effects work, and check out some of the results possible using them.

I’ll start with a simple polygon layer, with some nice plain styling:

Nice and boring polygon layer

A nice and boring polygon layer

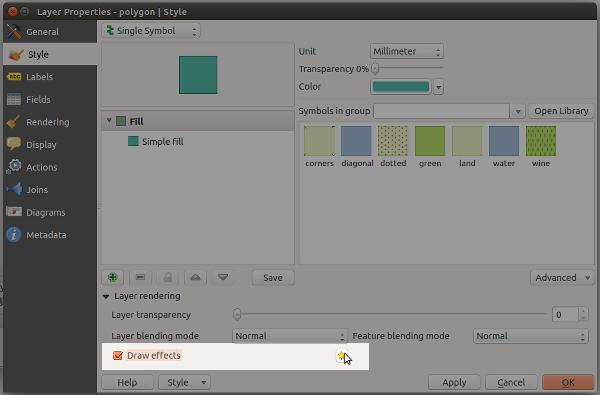
If I open the properties for this layer and switch to the Style tab, there’s a new checkbox for “Draw effects“. Let’s enable that, and then click the little customise effects button to its right:

Enabling effects for the layer

Enabling effects for the layer

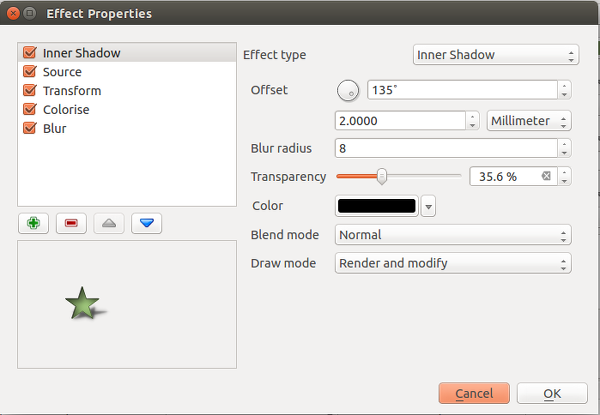
A new “Effects Properties” dialog opens:

Effects Properties dialog

Effects Properties dialog

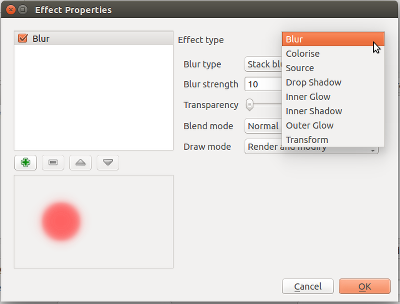
You can see that currently the only effect listed is a “Source” effect. Source effects aren’t particularly exciting – all they do is draw the original layer unchanged. I’m going to change this to a “Blur” effect by clicking the “Effect type” combo box and selecting “Blur“:

Changing to a blur effect

Changing to a blur effect

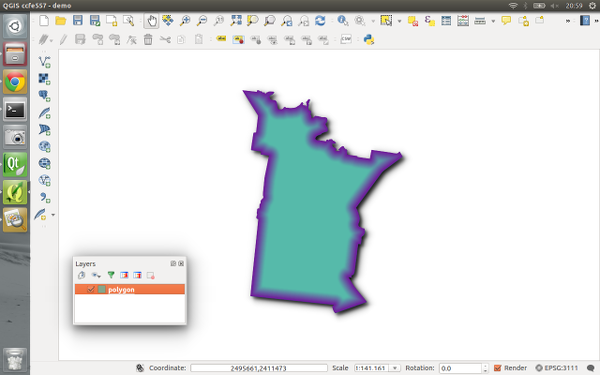
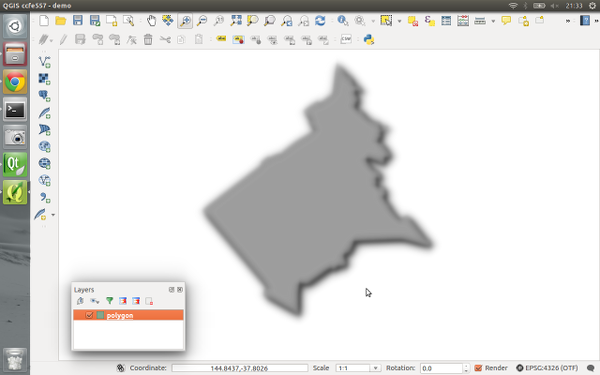
If I apply the settings now, you’ll see that the polygon layer is now blurry. Now we’re getting somewhere!

Blurry polygons!

Blurry polygons!

Ok, so back to the Effects Properties dialog. Let’s try something a bit more advanced. Instead of just a single effect, it’s possible to chain multiple effects together to create different results. Let’s make a traditional drop shadow by adding a “Drop shadow” effect under the “Source” effect:

Setting up a drop shadow

Setting up a drop shadow

Effects are drawn top-down, so the drop shadow will appear below the source polygons:

Live drop shadows!

Live drop shadows!

Of course, if you really wanted, you could rearrange the effects so that the drop shadow effect is drawn above the source!..

Hmmmm

Hmmmm…

You can stack as many effects as you like. Here’s a purple inner glow over a source effect, with a drop shadow below everything:

Inner glow, source, drop shadow...

Inner glow, source, drop shadow…

Now it’s time to get a bit more creative… Let’s explore the “transform” effect. This effect allows you to apply all kinds of transformations to your layer, including scaling, shearing, rotation and translation:

The transform effect

The transform effect

Here’s what the layer looks like if I add a horizontally shearing transform effect above an outer glow effect:

Getting freaky...

Getting tricky…

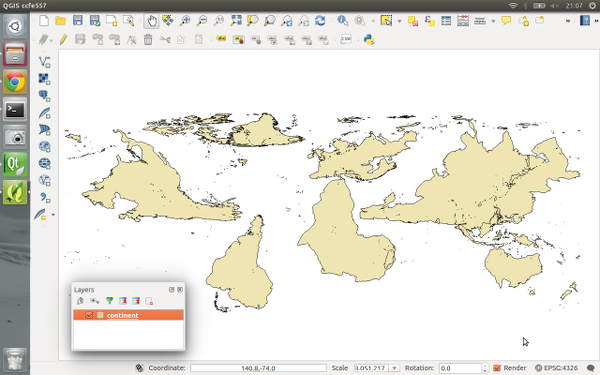
Transforms can get really freaky. Here’s what happens if we apply a 180° rotation to a continents layer (with a subtle nod to xkcd):

Change your perspective on the world!

Change your perspective on the world!

Remember that all these effects are applied when the layers are rendered, so no modifications are made to the underlying data.

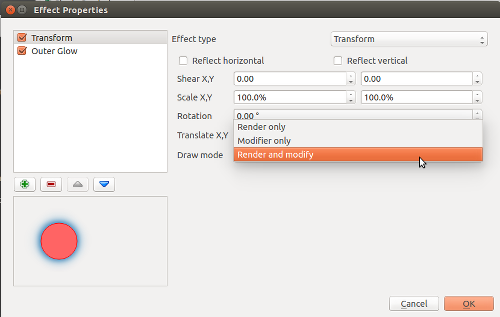
Now, there’s one last concept regarding effects which really blasts open what’s possible with them, and that’s “Draw modes“. You’ll notice that this combo box contains a number of choices, including “Render“, “Modify” and “Render and Modify“:

"Draw mode" options

“Draw mode” options

These draw modes control how effects are chained together. It’s easiest to demonstrate how draw modes work with an example, so this time I’ll start with a Transform effect over a Colorise effect. The transform effect is set to a 45° rotation, and the colorise effect set to convert to grayscale. To begin, I’ll set the transform effect to a draw mode of Render only:

The "Render only" draw mode

The “Render only” draw mode

In this mode, the results of the effect will be drawn but won’t be used to modify the underlying effects:

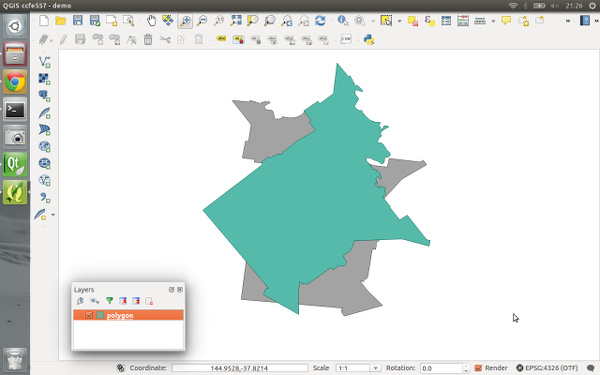
Rotation effect over the grayscale effect

Rotation effect over the grayscale effect

So what we have here is that the polygon is drawn rotated by 45° by the transform effect, and then underneath that there’s a grayscale copy of the original polygon drawn by the colorise effect. The results of the transform effect have been rendered, but they haven’t affected the underlying colorise effect.

If I instead set the Transform effect’s draw mode to “Modifier only” the results are quite different:

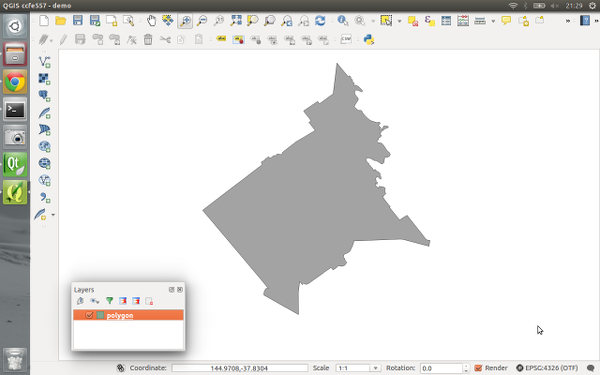
Rotation modifier for grayscale effect

Rotation modifier for grayscale effect

Now, the transform effect is rotating the polygon by 45° but the result is not rendered. Instead, it is passed on to the subsequent colorise effect, so that now the colorise effect draws a grayscale copy of the rotated polygon. Make sense? We could potentially chain a whole stack of modifier effects together to get some great results. Here’s a transform, blur, colorise, and drop shadow effect all chained together using modifier only draw modes:

A stack of modifier effects

A stack of modifier effects

The final draw mode, “Render and modify” both renders the effect and applies its result to underlying effects. It’s a combination of the two other modes. Using draw modes to customise the way effects chain is really powerful. Here’s a combination of effects which turn an otherwise flat star marker into something quite different:

Lots of effects!

Lots of effects!

The last thing I’d like to point out is that effects can be either applied to an entire layer, or to the individual symbol layers for features within a layer. Basically, the possibilities are almost endless! Python plugins can also extend this further by implementing additional effects.

All this work was funded through the 71 generous contributors who donated to the crowdfunding campaign. A big thank you goes out to you all whole made this work possible! I honestly believe that this feature takes QGIS’ cartographic possibilities to whole new levels, and I’m really excited to see the maps which come from it.

Lastly, there’s two other crowdfunding campaigns which are currently in progress. Lutra consulting is crowdfunding for a built in auto trace feature, and Radim’s campaign to extend the functionality of the QGIS GRASS plugin. Please check these out and contribute if you’re interested in their work and would like to see these changes land in QGIS.

Tagged , , , , , ,

Kickstarter Alert – Live Layer Effects for QGIS

QGIS is well regarded for its fantastic cartographic abilities – it’s got a huge range of symbology styles and options which can be used to style your maps. But there’s more we can do to push this even further.

One long requested cartographic feature has been for live drop shadows on layers. Why stop there? Why not inner and outer glow effects and live blur effects? Just imagine the cartographic possibilities if this functionality was available from within a GIS, and didn’t require exporting maps to external editors…

I’ve launched a Kickstarter project to fund implementing live layer effects like this within QGIS. Please consider donating or spreading the word if you’d find this feature useful!

Tagged , , , , ,

Shapeburst fill styles in QGIS 2.4

With QGIS 2.4 getting closer (only a few weeks away now) I’d like to take some time to explore an exciting new feature which will be available in the upcoming release… shapeburst fills!

As a bit of background, QGIS 2.2 introduced a gradient fill style for polygons, which included linear, radial and conical gradients. While this was a nice feature, it was missing the much-requested ability to create so-called “buffered” gradient fills. If you’re not familiar with buffered gradients, a great example is the subtle shading of water bodies in the latest incarnation of Google maps. ArcGIS users will also be familiar with the type of effects possible using buffered gradients.

Gradient fills on water bodies in Google maps

Gradient fills on water bodies in Google maps

Implementing buffered gradients in QGIS originally started as a bit of a challenge to myself. I wanted to see if it was possible to create these fill effects without a major impact on the rendering speed of a layer. Turns out you can… well, you can get pretty close anyway. (QGIS 2.4’s new multi-threaded responsive rendering helps a lot here too).

So, without further delay, let’s dive into how shapeburst fills work in QGIS 2.4! (I’ve named this fill effect ‘shapeburst fills’, since that’s what GIMP calls it and it sounds much cooler than ‘buffered gradients’!)

Basic shapeburst fills

For those of you who aren’t familiar with this fill effect, a shapeburst fill is created by shading each pixel in the interior of a polygon by its distance to the closest edge. Here’s how a lake feature polygon looks in QGIS 2.4 with a shapeburst from a dark blue to a lighter blue colour:

A simple shapeburst fill from a dark blue to a lighter blue

A simple shapeburst fill from a dark blue to a lighter blue

You can see in the image above that both polygons are shaded with the dark blue colour at their outer boundaries through to the lighter blue at their centres. The screenshot below shows the symbol settings used to create this particular fill:

A simple shapeburst fill from a dark blue to a lighter blue

Creating a simple shapeburst fill from a dark blue to a lighter blue

Here we’ve used the ‘Two color‘ option, and chosen our shades of blue manually. You can also use the ‘Color ramp’ option, which allows shading using a complex gradient containing multi stops and alpha channels. In the image below I’ve created a red to yellow to transparent colour ramp for the shapeburst:

Colour ramp shapeburst with alpha channels

Colour ramp shapeburst with alpha channels

Controlling shading distance

In the above examples the shapeburst fill has been drawn using the whole interior of the polygon. If desired, you can change this behaviour and instead only shade to a set distance from the polygon edge. Let’s take the blue shapeburst from the first example above and set it to shade to a distance of 5 mm from the edge:

Shapeburst fills can shade to a set distance only

Shapeburst fills can also shade to a set distance from the polygon’s exterior

This distance can either be set in millimetres, so that it stays constant regardless of the map’s scale, or in map units, so that it scales along with the map. Here’s what our lake looks like shaded to a 5 millimetre distance:

Shading to 5mm from the lake's edge

Shading to 5mm from the lake’s edge

Let’s zoom in on a portion of this shape and see the result. Note how the shaded distance remains the same even though we’ve increased the scale:

Zooming in maintains a constant shaded distance

Zooming in maintains a constant shaded distance

Smoothing shapeburst fills

A pure buffered gradient fill can sometimes show an odd optical effect which gives it an undesirable ‘spiny’ look for certain polygons. This is most strongly visible when using two highly contrasting colours for the fill. Note the white lines which appear to branch toward the polygon’s exterior in the image below:

Spiny artefacts on a pure buffered gradient fill

Spiny artefacts on a pure buffered gradient fill

To overcome this effect, QGIS 2.4 offers the option to blur the results of a shapeburst fill:

Blur option for shapeburst fills

Blur option for shapeburst fills

Cranking up the blur helps smooth out these spines and results in a nicer fill:

Adding a blur to the shapeburst fill

Adding a blur to the shapeburst fill

Ignoring interior rings

Another option you can control for shapeburst fills is whether interior polygon rings should be ignored. This option is useful for shading water bodies to give the illusion of depth. In this case you may not want islands in the polygon to affect their surrounding water ‘depth’. So, checking the ‘Ignore rings in polygons while shading‘ option results in this fill:

Ignoring interior rings while shading

Ignoring interior rings while shading

Compare this image with the first image posted above, and note how the shading differs around the small island on the polygon’s left.

Some extra bonuses…

There’s two final killer features with shapeburst fills I’d like to highlight. First, every parameter for the fill can be controlled via data defined expressions. This means every feature in your layer could have a different start and end colour, distance to shade, or blur strength, and these could be controlled directly from the attributes of the features themselves! Here’s a quick and dirty example using a random colour expression to create a basic ‘tint band‘ effect:

Using a data defined expression for random colours

Using a data defined expression for random colours

Last but not least, shapeburst fills also work nicely with QGIS 2.4’s new “inverted polygon” renderer. The inverted polygon renderer flips a normal fill’s behaviour so that it shades the area outside a polygon. If we combine this with a shapeburst fill from transparent to opaque white, we can achieve this kind of masking effect:

Creating a smooth exterior mask using the "inverted polygons" renderer

Creating a smooth exterior mask using the “inverted polygons” renderer

This technique plays nicely with atlas prints, so you can now smoothly fade out the areas outside of your coverage layer’s features for every page in your atlas print!

All this and more, coming your way in a few short weeks when QGIS 2.4 is officially released…

Tagged , , , , , ,

QGIS – Two neat features in 2.2

Here’s a quick run-down on two nice new styling options which I’ve recently added to QGIS 2.2.

Map styling for compositions

This little feature was suggested by Mathieu Pellerin, who is always pushing the boundaries of QGIS’ cartographic tools and coming up with great ideas for new styling features (you can check out some of his work via Flickr). Mathieu’s idea was for a new ‘$map‘ variable for the expression builder. This variable holds the id of the map item which is drawing the map, and allows for some nice tweaking of maps in the composer.

The $map variable is most useful when you have more than one map in your composition. The example below shows $map being used to change the styling of a single layer from the main map to the smaller inset map:

Using $map to style two maps with different colours

Using $map to style a single layer in two maps with different colours

In this example the composition has two maps, the larger has an id of “main_map” and the smaller has “inset_map“. The boundary layer has been styled using the rule based renderer, with one rule for $map=’main_map’ and one for $map=’inset_map’, as shown below:

Rule based rendering using the $map variable

Rule based rendering using the $map variable

The end result is that the layer will be rendered using the two different styles depending on which composer map item it is being drawn into. This trick can also be used to tweak labelling rules between the maps. In the example above I’ve restricted the labelling to only show in the main map. This is achieved by setting an expression for the data defined “Show label” property. I’ve used the expression “$map=’main_map’” so that labels are only shown in the main map and not the smaller inset map.

Tweaking label settings using the $map variable

Tweaking label settings using the $map variable

This small addition to QGIS 2.2 allows for some rather powerful improvements to multi-map compositions!

Drawing polygon borders only inside the polygon

The second new feature I wanted to highlight is a new option for polygon outlines which causes the outline to be drawn only on the inside of a polygon feature. The usual behaviour is for outlines to be drawn directly over the centre of the feature boundary, so that half of the outline is drawn inside the feature and half on the outside.

Simple Line Fill before

This means that the outline in a simple line symbol layer overlaps into the neighbouring polygons, and the result is that outlines from these features blend together:

Shaded borders pre QGIS 2.2

Shaded borders pre QGIS 2.2 – see how the colours bleed into the neighbouring features and overlap

This looks like a big muddy mess. A feature I’ve wanted for a long time is the ability to restrict these outlines so that they are only drawn inside the feature. This effect is commonly seen in world atlases and National Geographic maps, where each neighbouring country is shaded with it’s own unique outline colour. Now it’s possible to do this in QGIS just by ticking a single box!

The new "Draw line only inside polygon" option

The new “Draw line only inside polygon” option

As you can see in the above image, the simple line outline style has a new checkbox, “Draw line only inside polygon“. Ticking this box will clip the outline so that only the portion of it which falls inside the feature is rendered. Here’s the result:

Shaded borders with "Draw line only inside polygon" checked

Shaded borders with “Draw line only inside polygon” checked

So much nicer then the earlier output – now none of the borders overlap into their neighbouring regions! Ok, so it is possible to achieve a similar result by creating a specially crafted layer consisting of negatively buffered polygons subtracted from the original polygons, but this takes a lot of fiddling around. It also has the major disadvantage in that the result is scale dependant, and zooming in or out of the map will alter the size of the polygon outlines. But using this wonderful new checkbox in QGIS, we get proper scale-independent borders, and zooming in or out of the map keeps a consistent border width!

Zooming in keeps a consistent border width...

Zooming in keeps a consistent border width…

So there we go – two small new features added in QGIS 2.2 which have huge potential for your cartographic outputs! As per usual, if you come up with some fancy way of utilising these, don’t forget to add your maps to the QGIS Showcase on Flickr.

Tagged , , , , , ,